
Kyriba’s Q2 2024 Corporate Liquidity Performance Research Reveals Rising Short-Term Liquidity
Staying ahead in finance requires strategic agility and robust liquidity management. We recently conducted research that sheds light on how leading U.S. corporations are navigating the challenges of modern corporate finance, showcasing a notable rise in short-term liquidity to $3.5 trillion.
Our Q2 2024 research delved into the patterns and drivers behind this liquidity growth. To determine liquidity patterns, we analyzed corporate liquidity markers for public U.S. corporations with annual revenues exceeding $1 billion across various industries.
We focused on short-term liquidity as a clear indicator of how corporations can rapidly respond to changing economic conditions. This liquidity provides security during times of uncertainty while simultaneously positioning organizations to capitalize on potential growth opportunities as soon as economic indicators become more favorable.
Additionally, our analysis highlighted how organizations are successfully leveraging advanced treasury management technology to safeguard their financial health and optimize their ability to capitalize on favorable market conditions.
What Is Driving the Short-Term Liquidity Increase?
Our data shows short-term liquidity as $3.5 trillion at the end of Q2 2024, a $170 billion increase from the same period in 2023. Short-term investments and cash remained relatively stable, growing by around 13.3% in June 2024 compared to the same period in 2023. Additionally, credit available on short-term facilities increased only 7.6% in June year over year.
"Short-term liquidity" is defined as total cash + short-term investments + total undrawn credit – current portion of long-term debt
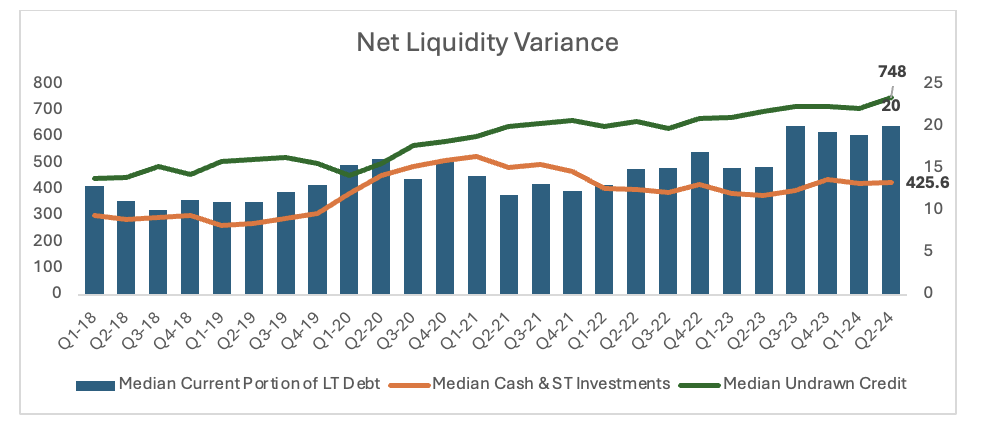
The $3.5 trillion increase in short-term corporate liquidity indicates that corporations were building liquidity earlier in 2024 due to economic uncertainty and market volatility; however, they may now be positioning themselves for a period of growth as these fears begin to subside.
So, what is driving the overall increase? It is a lingering impact of economic decisions made during the years of the COVID-19 pandemic. During 2020, many organizations took on a significant amount of 5-year debt in the form of term loans at near zero interest rates to ensure financial sustainability during this period of intense economic uncertainty. With the scheduled maturity of these loans on the horizon in 2025, organizations must now evaluate their next course of action, as the current portion of long-term debt increased a staggering 31.6% in June 2024 compared to June 2023.
Our research showed that many corporations are increasing cash balances in anticipation of either paying off this debt or preparing to refinance (depending on expected liquidity capacity in 2025). This liquidity build-up could also indicate preparation for funding growth initiatives at the end of 2024 and into 2025 as economic confidence continues to build.
Does Size Matter?
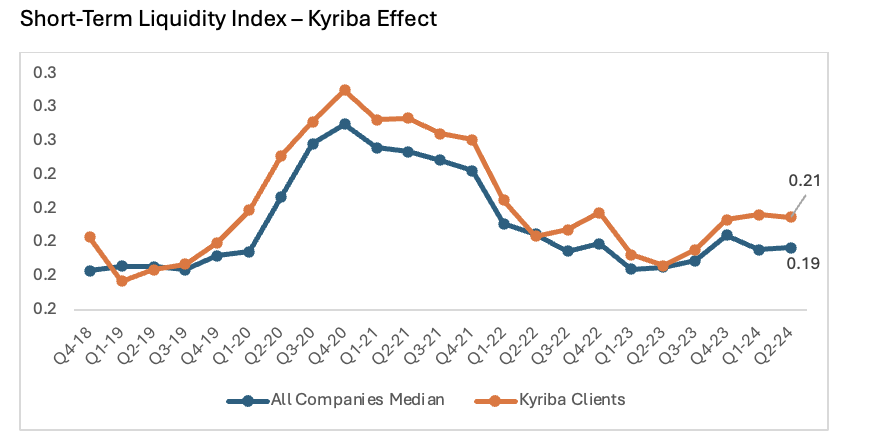
Our study evaluated corporate liquidity by establishing the Kyriba Short-Term Liquidity (STL) Index, which normalizes short-term liquidity per billion in annual revenue.
By segmenting corporations into different revenue ranges, the study revealed some interesting insights regarding how revenue size impacts organizations' strategic liquidity management decisions. Liquidity capacity increased for smaller organizations (under $10 billion in revenue), as compared to a notable decrease from Q1 2024 in capacity for larger organizations (over $50 billion in revenue).
A driving factor in this disparity is likely tied to the response and anticipated impact of probable interest rate reductions in 2025. Smaller organizations seem focused on investing cash to take advantage of the higher interest rates while they still can. Meanwhile, larger organizations are preparing to fund future potential growth investments through increased borrowing as the economic outlook for 2025 continues to brighten.
The Kyriba Effect on Corporate Liquidity
To gain a more comprehensive understanding of how leveraging technology impacted liquidity, we evaluated two key indicators: the short-term liquidity index and cash conversion cycle of Kyriba versus non-Kyriba clients. The findings point to an advantage for companies leveraging cutting edge technology in their liquidity performance management. At the end of Q2 2024, corporations using the Kyriba platform demonstrated a 10.5% improvement in their ability to generate greater disposable liquidity compared to all other corporations in the study.
Automated, reliable, and timely visibility combined with technology-driven, dynamic forecasting capabilities empowers these corporations to make better-informed strategic decisions for prime liquidity optimization. For example, Kyriba client Cenveo achieved 93% forecast accuracy and 90% productivity improvements after their digital transformation with Kyriba’s Liquidity Performance Platform.
Best practices facilitated by Kyriba also accelerated corporations’ conversion of revenue into cash as indicated by the cash conversion cycle (CCC). The lower an organization’s CCC, the faster revenue is converted into actual cash. Based on the study, Kyriba clients demonstrated a 6.8-day CCC advantage over non-Kyriba clients as of June 30, 2024, translating into a $18.9M per billion in revenue working capital buffer. Kyriba clients have historically optimized liquidity after implementing Kyriba’s Liquidity Performance Platform. For example, Kyriba client HCSC reduced idle cash by 90 percent from $4.0B to $25M.
Systematic management of the days sales outstanding (DSO) and days payable outstanding (DPO) (key aspects of the CCC) through supply chain financing and receivable financing enabled these corporations to generate this buffer, reducing their need to draw on available liquidity and improving overall yield on cash. Using supply chain finance solutions, organizations can lower financing costs and enhance cash flow, freeing up capital for improved financial management and investment opportunities.
These solutions assist in consistently extracting capital, avoiding over-investment in inventory, and ensuring efficient collection and payment processes. For example, Kyriba clients Specialized Bicycle Components and Driven Brands both unlocked the potential of supply chain finance to improve cash flow and working capital management.
How to Thrive in an Ever-Changing Economy
The insights from our study highlight the strategic maneuvers corporations are adopting to navigate today's economic complexities. By leveraging advanced liquidity performance techniques, companies are not only safeguarding their financial foundations but also positioning themselves for future growth. The increase in short-term liquidity among U.S. corporations underscores a proactive approach to managing economic uncertainties and seizing emerging market opportunities.
As the data demonstrates, effective use of technology significantly enhances liquidity optimization, providing companies with a competitive edge. Overwhelmingly, Kyriba clients have shown remarkable improvements in forecast accuracy and cash conversion efficiency, reflecting the tangible benefits of integrating such solutions into their financial strategies.
Looking ahead, as the economic outlook continues to evolve, it's clear that those who prioritize strategic liquidity management, supported by robust technology, will be best positioned to thrive. By continuing to optimize their financial strategies, organizations can ensure resilience and capitalize on growth opportunities in an ever-changing business environment.